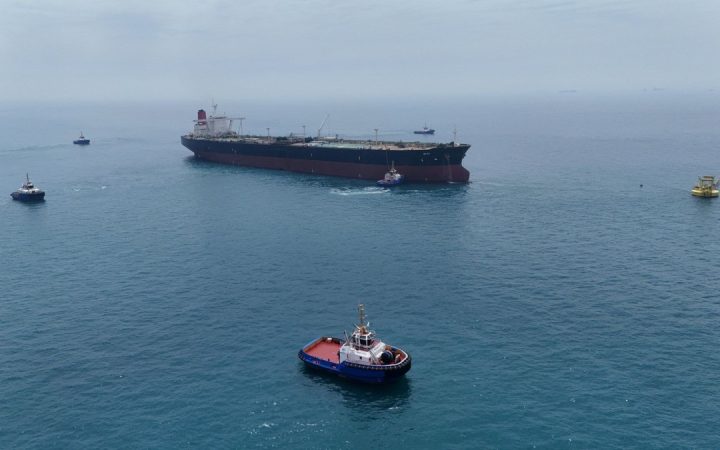
Visual Capitalist published an analysis mapping global crude oil and condensate trade through the Strait of Hormuz, utilizing data from the U.S. Energy Information Administration for the first quarter of 2025. The findings show that Asian economies receive 89.2% of all crude and condensate passing through the maritime corridor.
China represents the largest single destination by a significant margin, absorbing 37.7% of total crude and condensate volumes transiting the strait. India accounts for the second-largest share at 14.7%, followed by South Korea at 12.0%, Japan at 10.9%, and other Asian markets at 13.9%.
On the export side, outbound shipments through the waterway remain heavily concentrated among Persian Gulf producers. Saudi Arabia accounts for 37.2% of crude and condensate exports, followed by Iraq at 22.8% and the United Arab Emirates at 12.9%. Iran contributes 10.6%, Kuwait accounts for 10.1%, Qatar represents 4.4%, and other origins make up 1.9%. Together, the top five exporters represent 93.6% of total volumes shipped through the strait.
Sources
- EnergyNow.com · 2026-10-07